21 May 2026
Position Power Plays: Exploring Draw Biases in Australian Thoroughbred Sprint Racing
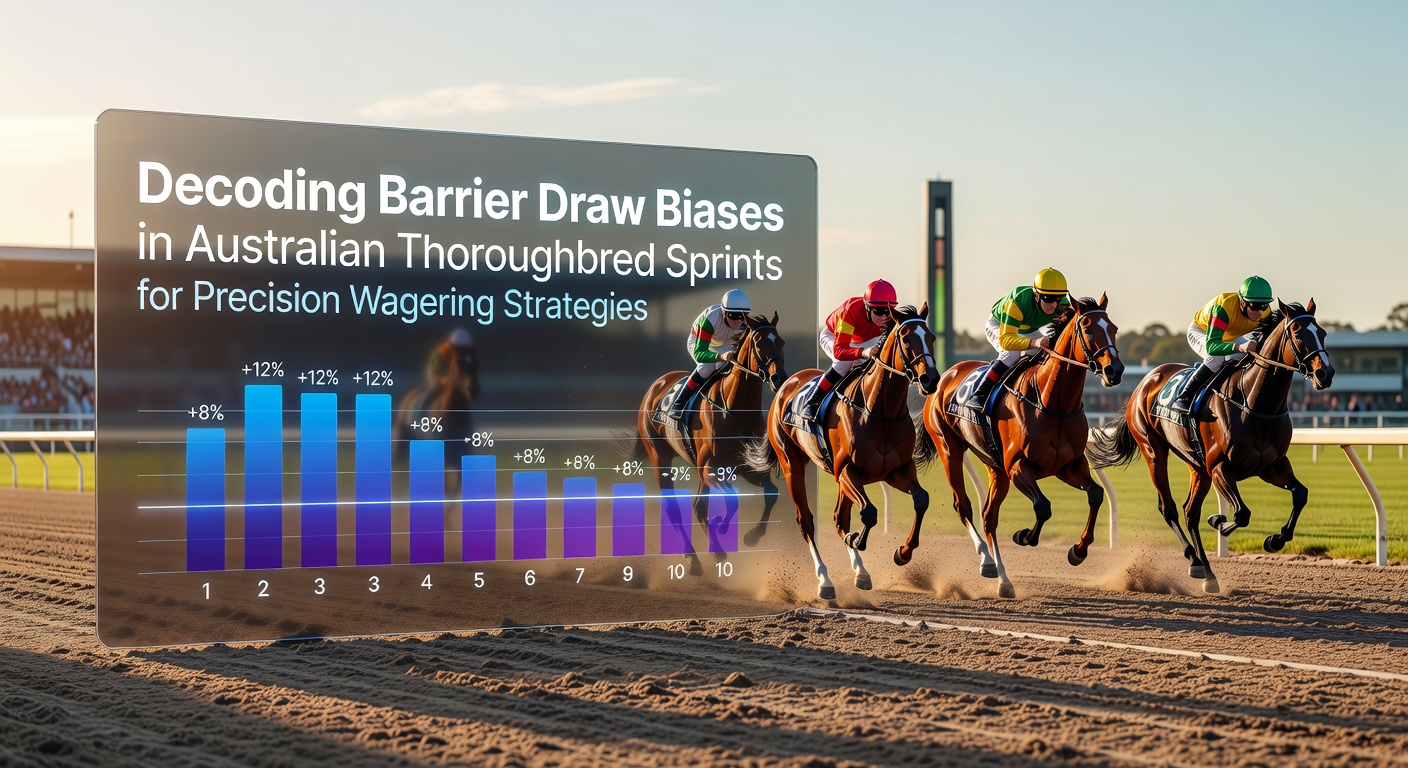
Australian thoroughbred sprints deliver some of the most intricate positional dynamics in global racing, where barrier draws shape outcomes from the first stride onward. Tracks across the country, from the tight turns at Randwick to the sweeping expanses at Flemington, reveal consistent patterns that researchers have documented over multiple seasons. Data from Racing Australia shows that inside draws in races under 1400 metres often reduce ground loss on the turn, while wider gates force horses to cover extra distance in the critical early stages.
Understanding Barrier Dynamics in Short-Distance Events
Barrier position influences pace and positioning because shorter sprint distances leave less room for recovery from a poor start. Experts at the Australian Racing Board have noted that horses drawn in gates one through four secure an average advantage of two to three lengths on the home turn in 1200-metre contests. This edge compounds when tracks run firm, since inside runners encounter less traffic and maintain momentum into the straight. Observers note that middle barriers, typically gates five through eight, produce mixed results depending on the rail configuration and prevailing wind conditions at each venue.
Those who study race replays frequently observe that outside draws in sprints require riders to expend early energy just to reach a competitive spot, which reduces finishing reserves. Figures from the 2025 season indicate that horses from gates nine and wider won only 12 percent of sprint races at metropolitan tracks, a trend that has held steady through early 2026 preparations.
Track-Specific Patterns Across Major Venues
Each Australian racing centre presents its own set of biases shaped by course geometry and surface type. At Doomben in Brisbane, the tight circumference amplifies the benefit of low draws in 1200-metre sprints, with statistical reviews showing inside horses achieving higher strike rates when the rail is true. In contrast, the long home straight at Caulfield allows some middle-drawn runners to settle and challenge late, although data still favours gates one to three overall.
Researchers from the University of Melbourne's equine performance laboratory examined five years of sprint results and found that bias strength varies with field size. Smaller fields reduce the impact of wide draws because fewer horses contest the early lead, yet larger fields magnify the advantage for inside runners as traffic increases. These findings align with reports compiled by international racing analysts who compare Australian tracks to similar short-distance circuits in Hong Kong and Singapore.
What's interesting is how pace maps interact with these positional factors. When a race features multiple speed horses drawn inside, the bias can neutralise because leaders use up energy fighting for the front. Yet when speed comes from wider gates, inside runners often enjoy a sit-and-sprint scenario that maximises their natural advantage.
Data Tools and Seasonal Trends for 2026
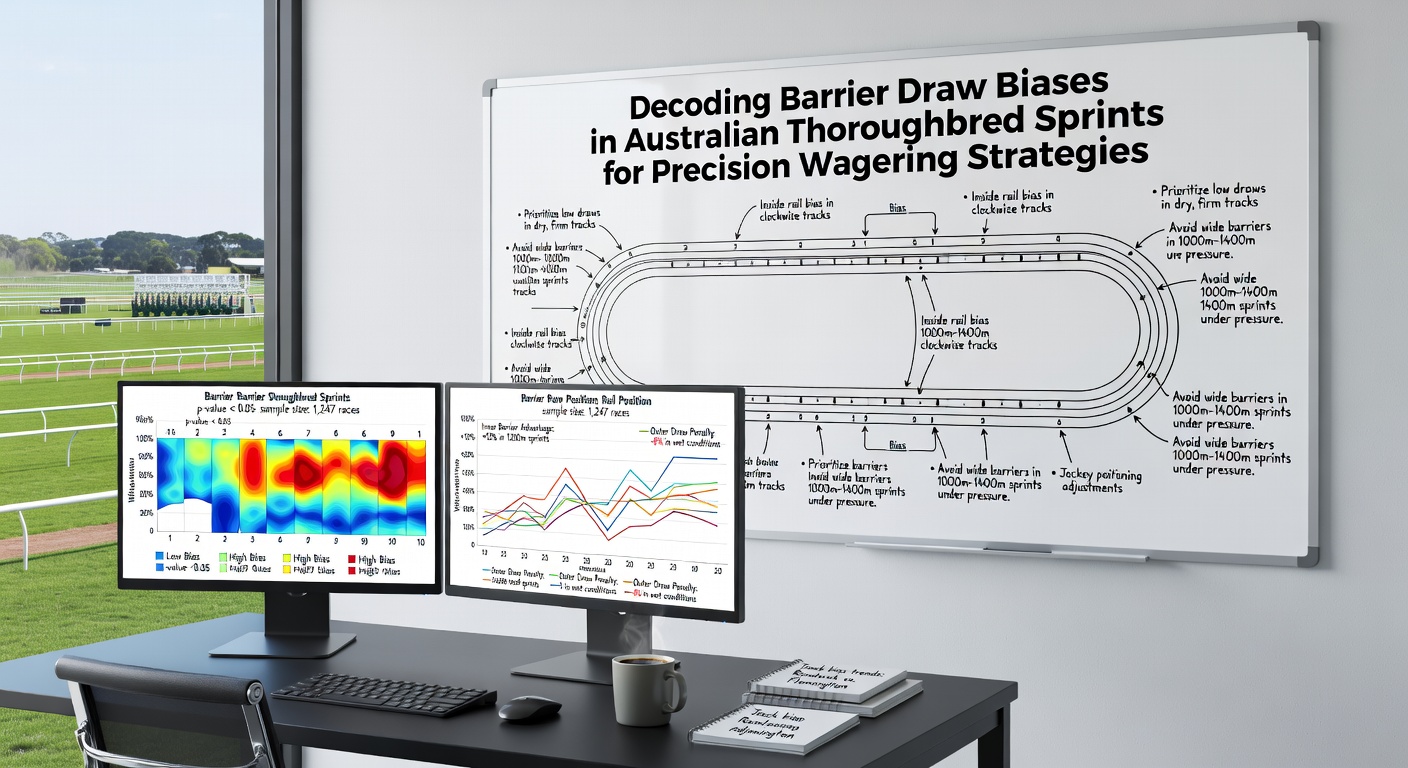
Modern wagering platforms now integrate barrier statistics directly into their interfaces, allowing users to filter past performances by draw and track condition. The Australian Turf Club publishes weekly reports that break down sprint results by barrier and distance, providing transparent datasets for anyone reviewing form. In May 2026, several major carnival meetings will test these patterns under autumn ground conditions that often firm up after early rains, potentially sharpening the inside advantage on drier surfaces.
One study released by the International Federation of Horseracing Authorities compared draw impacts across multiple jurisdictions and highlighted that Australian sprints exhibit stronger positional biases than their European counterparts, largely because of the clockwise direction and tighter turns common at local tracks. This research underscores why precision strategies often incorporate barrier-adjusted speed ratings rather than raw times alone.
Integrating Draw Analysis into Broader Form Evaluation
Successful approaches combine barrier data with other variables such as recent form, jockey statistics, and sectional times. For instance, a horse drawn wide but carrying low weight and possessing strong late-section figures may still offer value when the field lacks early speed. Conversely, an inside runner with a poor recent record rarely overcomes its positional edge if it lacks basic ability.
Those tracking the 2026 autumn carnivals will see these interactions play out at tracks hosting feature sprint events. Historical records show that trainers who understand local draw biases adjust their pre-race tactics, sometimes instructing riders to angle for the rail early or conserve energy for a wider run depending on the gate allocation.
Conclusion
Barrier draw analysis remains a foundational element of informed decision-making in Australian sprint racing. Comprehensive datasets from Racing Australia and academic reviews demonstrate measurable advantages for inside positions in short-distance events, while track geometry and field composition modulate the strength of those edges. Observers who integrate these patterns with pace maps and seasonal ground conditions gain a clearer picture of probable outcomes without relying on subjective impressions alone.