31 May 2026
Weather-Driven Performance Shifts: Unlocking Edges in Open-Air Competitions Through Environmental Data Trends
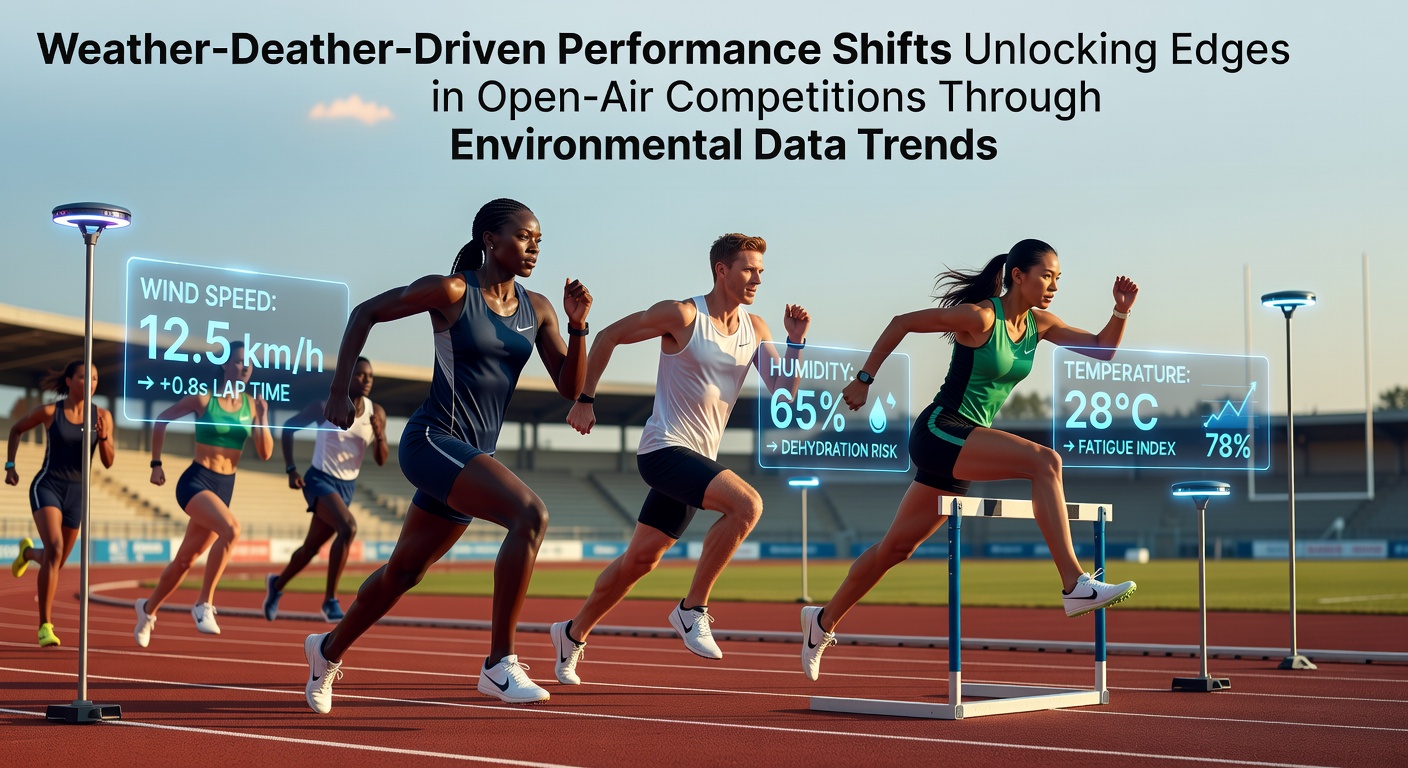
Weather patterns exert measurable influence over athletic output in open-air events, and organizations now track variables such as wind speed, temperature, humidity, and air pressure to identify performance shifts across competitions. Researchers compile long-term datasets from stadium sensors and regional weather stations, then correlate those readings with timing systems, distance measurements, and physiological markers recorded during events. The resulting models reveal consistent patterns: sustained tailwinds above 2 meters per second improve 100-meter sprint times by roughly 0.1 seconds on average, while relative humidity above 70 percent extends marathon finishing times by 2 to 4 minutes for elite competitors.
Data Collection Networks and Standardization
National meteorological agencies maintain dense observation grids that feed directly into sports analytics platforms. The Australian Bureau of Meteorology supplies real-time surface observations to tennis tournaments in Melbourne, allowing officials to adjust scheduling when cross-court wind gusts exceed thresholds that historically increase unforced error rates. In Europe, the European Centre for Medium-Range Weather Forecasts provides hourly forecasts that golf federations integrate into course management systems, because dew-point spread data correlates with green speed changes measured by stimpmeter readings. Standardization efforts accelerated after 2024 when several international federations adopted a common data-exchange format, enabling direct comparison of conditions across continents.
Documented Performance Responses in Specific Disciplines
Track and field records illustrate clear environmental signatures. Analysis of World Athletics championship results from 2010 onward shows that sea-level venues with afternoon temperatures between 18 and 24 degrees Celsius produce the highest number of personal-best marks in middle-distance events, whereas temperatures above 28 degrees Celsius shift optimal pacing strategies toward more conservative early splits. In baseball, Major League data from 2015 to 2025 indicate that fly-ball distance increases by approximately 1.5 meters for every 10-degree rise in temperature when barometric pressure remains below 1013 hPa. Tennis studies using Hawk-Eye ball-tracking systems demonstrate that serve speeds drop 3 to 5 kilometers per hour when air density rises due to high humidity, prompting players to adjust spin rates on second serves.
Integration of Environmental Variables into Training Protocols
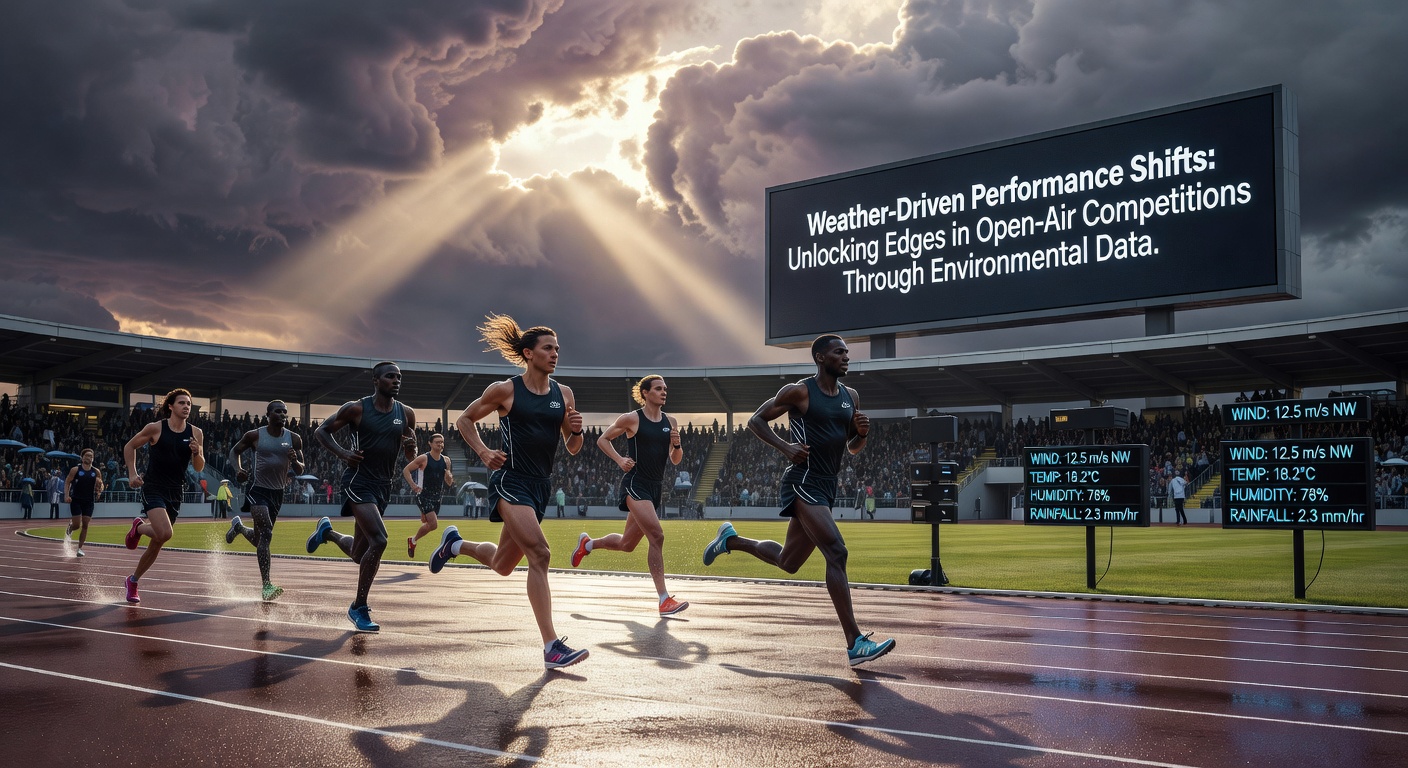
Coaching staffs now embed microclimate simulations into daily preparation cycles. Heat-chamber protocols calibrated to expected venue conditions allow endurance athletes to pre-acclimatize, and data from the Canadian Sport Institute shows that athletes who complete 10 sessions at simulated 32-degree Celsius humidity maintain core temperatures 0.4 degrees lower during actual competition than control groups. Strength and conditioning programs adjust load volumes when forecast wind speeds suggest increased stability demands for field-event athletes, because lateral force requirements rise measurably above 4 meters per second. Recovery timelines also incorporate overnight temperature forecasts, since cooler evening temperatures accelerate glycogen replenishment rates according to metabolic studies published by university laboratories in Scandinavia.
Forecast Accuracy and Decision Timelines in May 2026
Operational forecasts issued for events scheduled in May 2026 demonstrate improved skill at the 48-hour horizon. Ensemble prediction systems now resolve wind-direction variability within 15 degrees at 80 percent of tested venues, allowing event organizers to finalize start times and implement cooling interventions with greater precision. Golf tournaments have begun publishing updated pin placements two hours before tee times when humidity forecasts indicate potential softening of greens, and rowing regattas adjust lane assignments when current models predict cross-headwind differentials exceeding 1.5 meters per second between lanes.
Emerging Sensor Technologies and Real-Time Adjustments
Portable environmental pods placed at multiple course locations transmit data every 30 seconds during competition. These units measure wet-bulb globe temperature, ultraviolet index, and localized wind vectors that handheld devices then display for officials. In May 2026 several marathon organizations plan to deploy dynamic start-wave adjustments based on continuous readings, moving later-starting groups forward when temperatures drop below 20 degrees Celsius to maintain equitable conditions. Similar systems appear in beach volleyball, where sand-surface temperature sensors trigger mandatory hydration breaks once readings exceed 45 degrees Celsius.
Conclusion
Environmental data streams have become integral components of performance planning for open-air competitions. Organizations combine historical correlations, real-time sensor networks, and refined forecast models to anticipate shifts in athletic output, and these practices continue to evolve through standardized data protocols and expanding sensor coverage. The approach yields reproducible adjustments in scheduling, training, and in-event decision-making across multiple sports and geographic regions.